Tornado Warnings
Technology Used: ArcGIS Pro
About: This map is very similar to the US Drought map. I wanted to see if I could create a map similar to the drought map by myself from scratch.
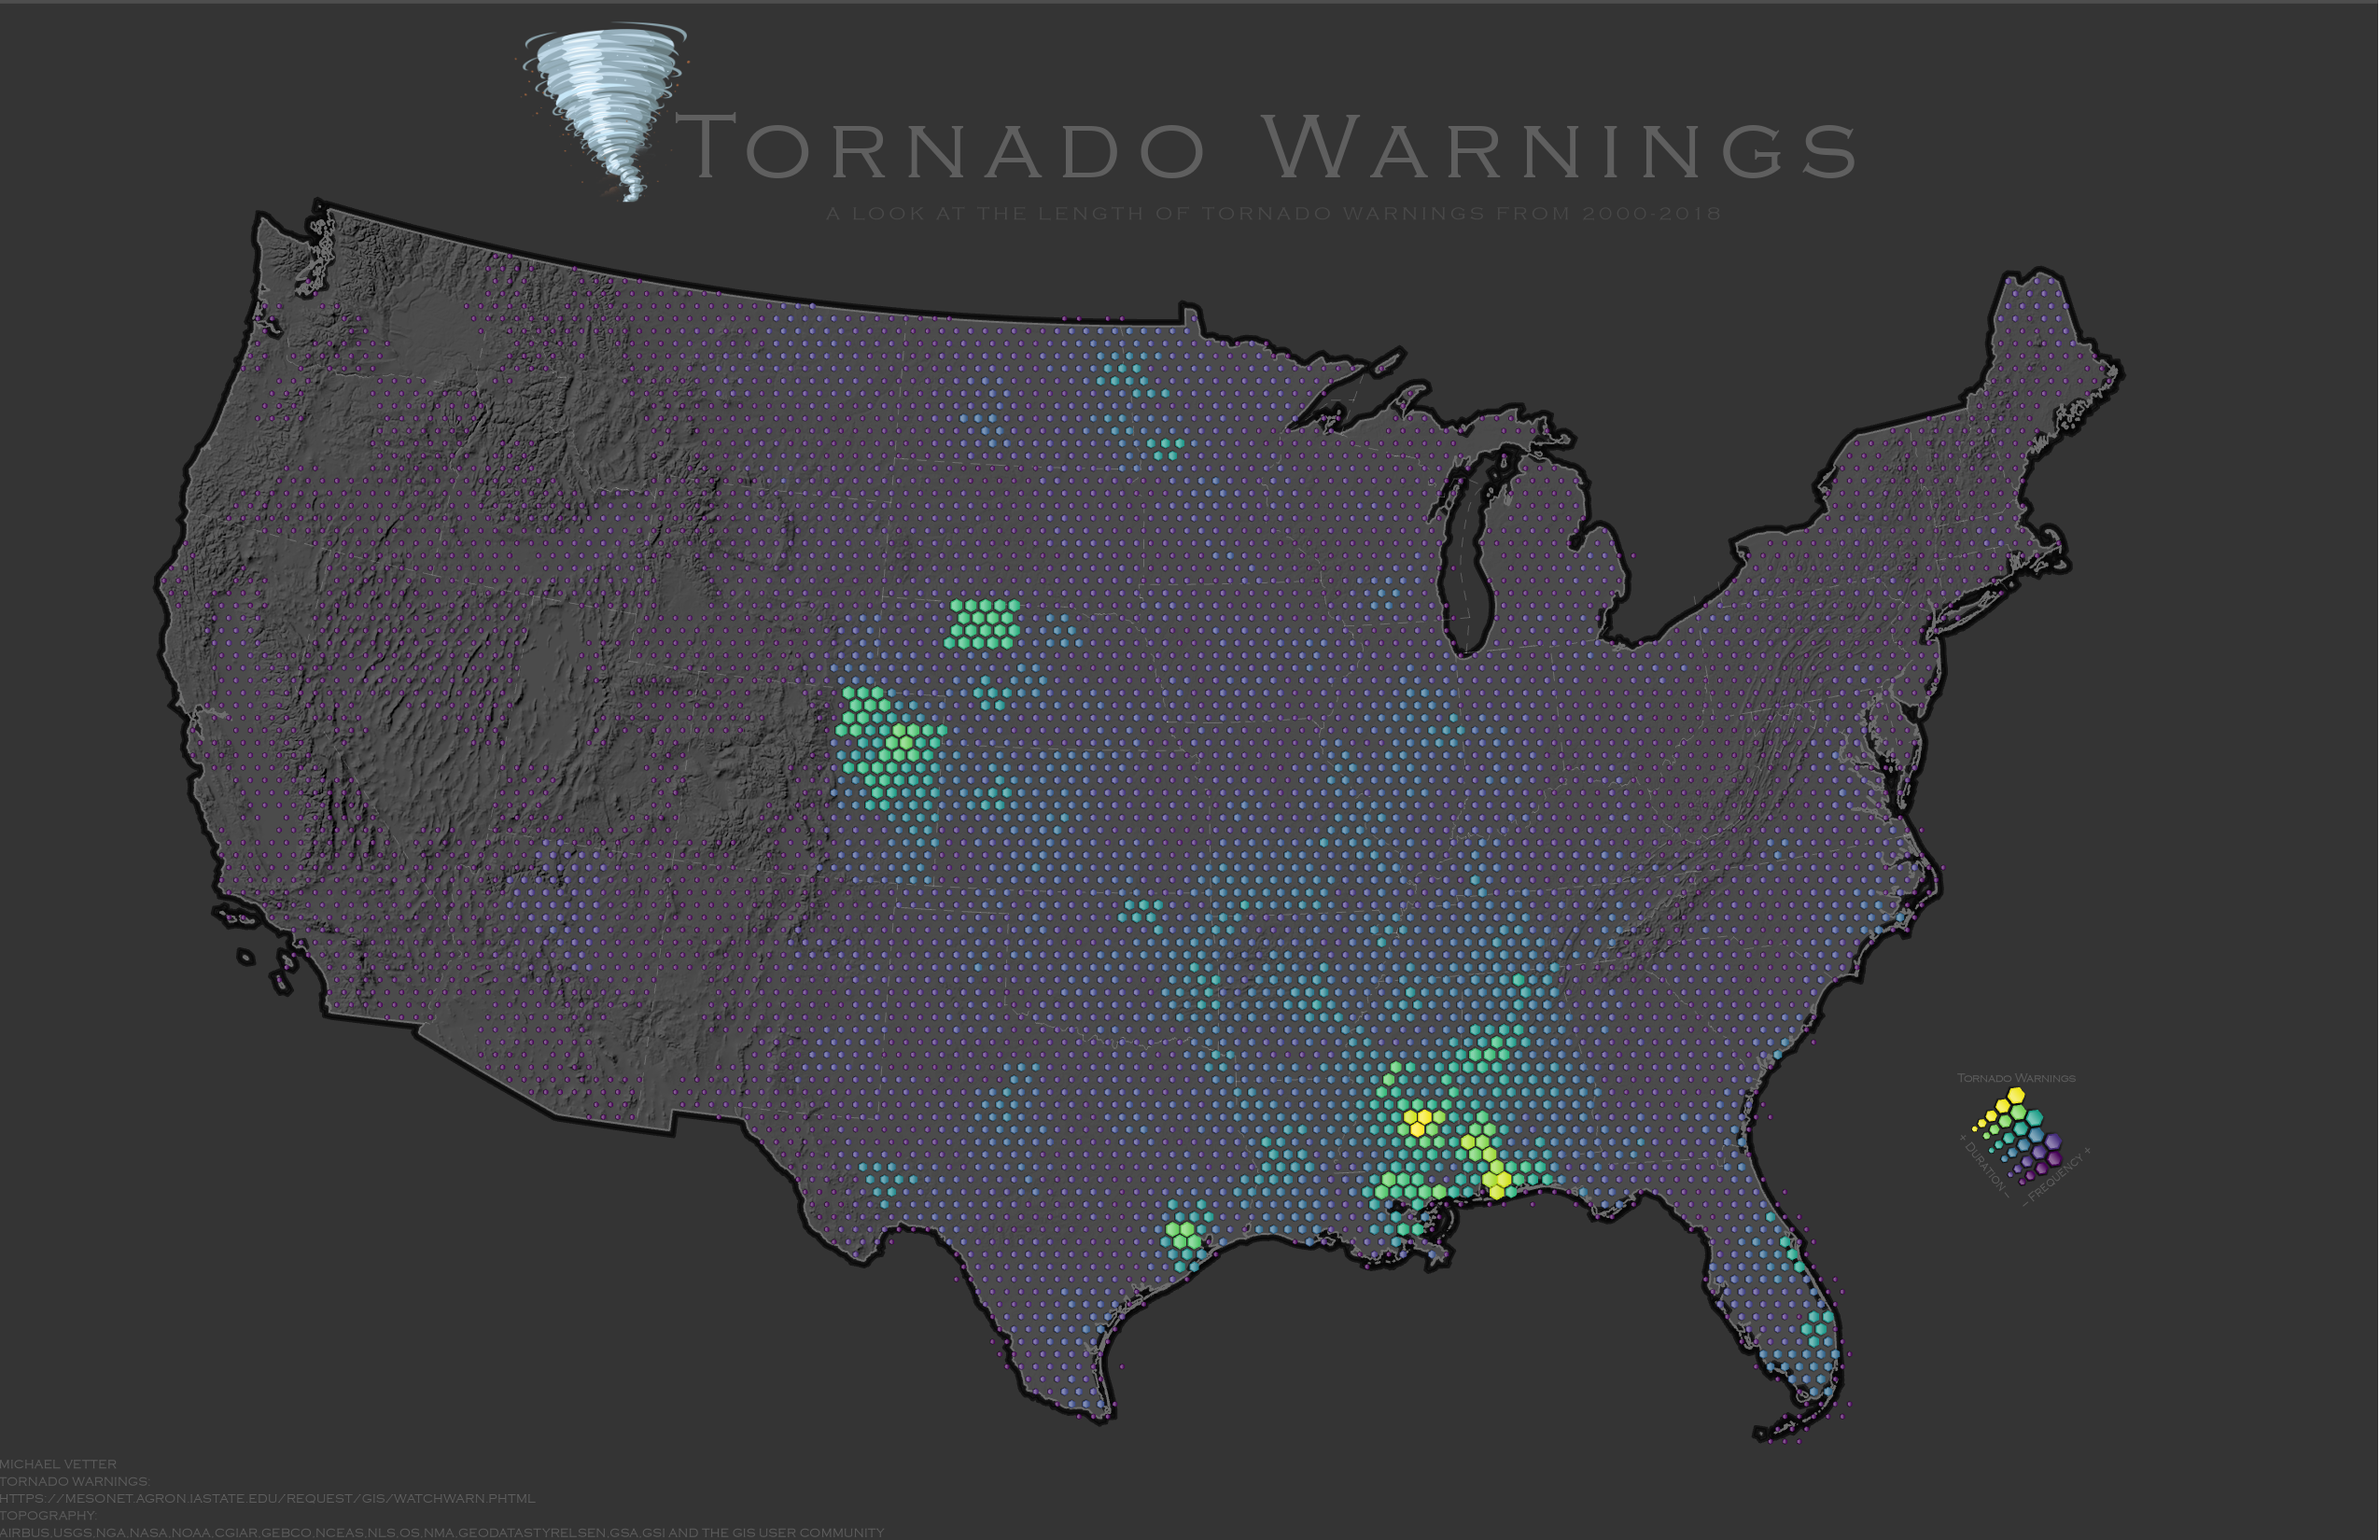
Process: I downloaded the data from Iowa Environmental Mesonet. Once I downloaded all the years, I added new fields to the data so that I could calculate the length of the warning. It was a straight forward process to get the times for the warnings. The time was shown in military time so I took the left 2 numbers and multiplied the number by 60. This would translate the hour into minutes. Then, I added the right 2 numbers to get a time in minutes. I did the same process for when the warning ended. I subtracted the ended time by the beginning time to get the length of the warning. Once I did this for every year, I merged all the shapefiles together. I spatially joined the tornado warning layer to a hexagon layer that I created. I created a bivariate map using the hexagons. The map shows the frequency of tornado warnings and the duration of the warnings.
