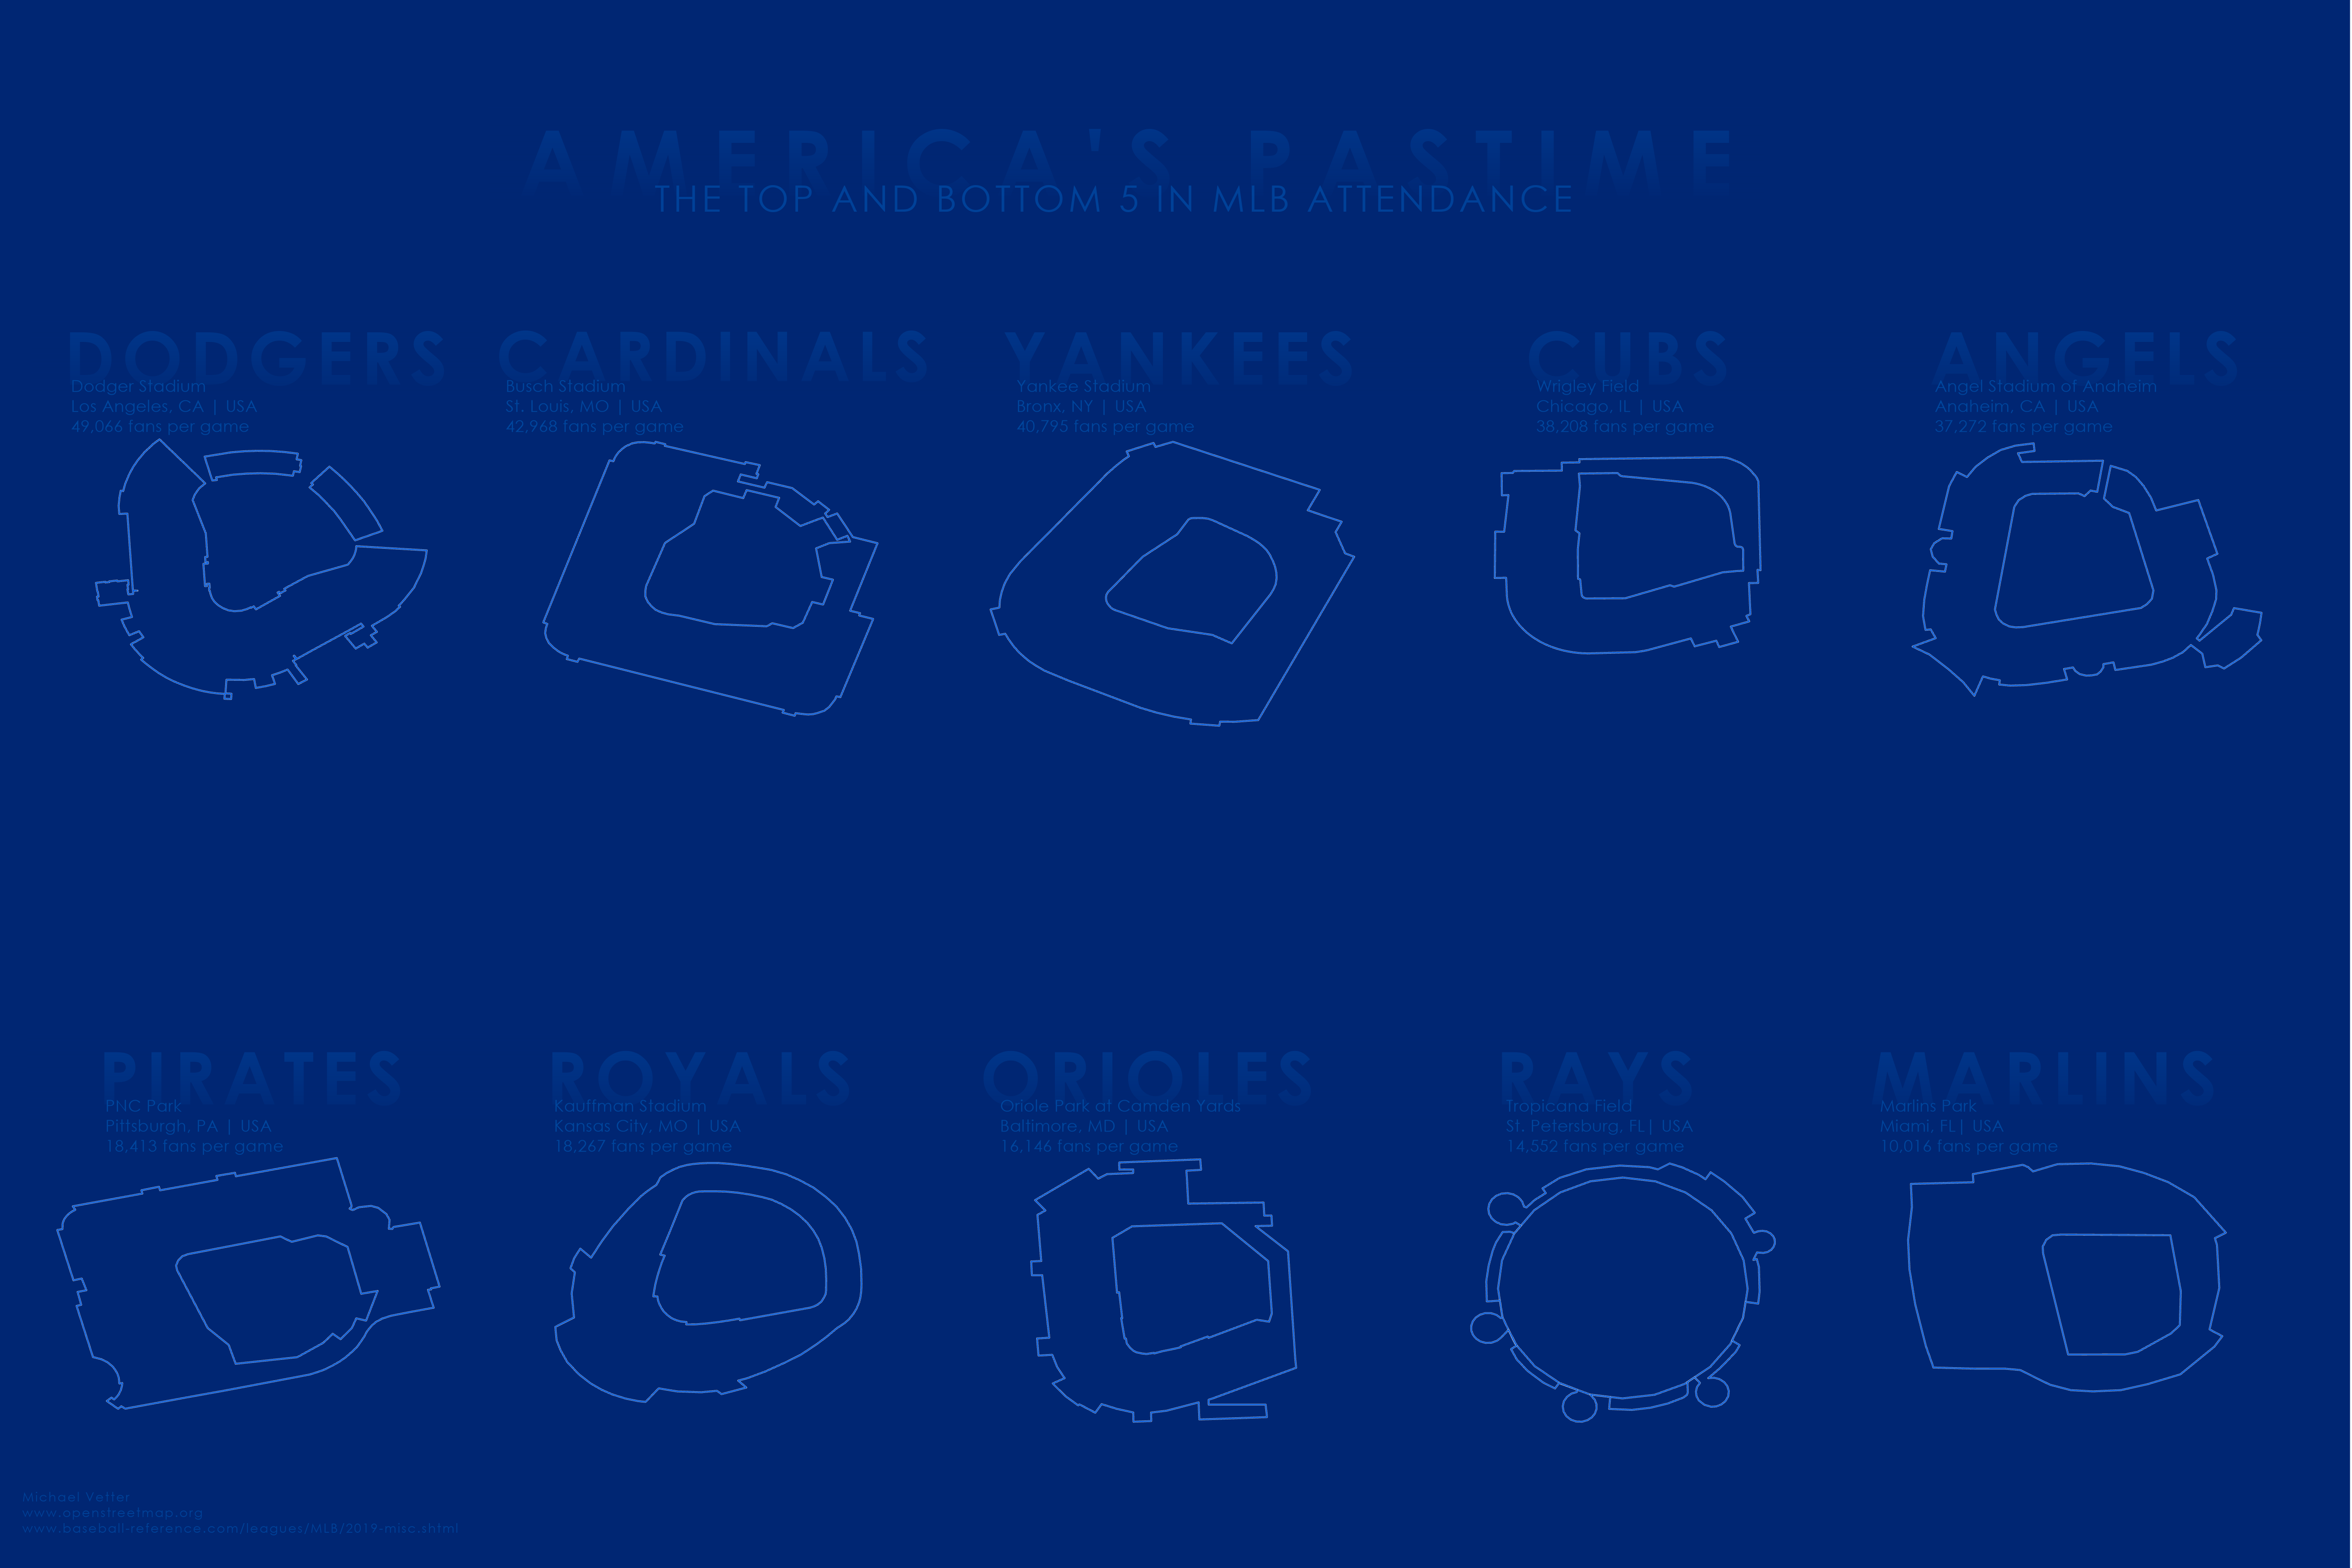
MLB Attendance
Technology Used: ArcGIS Pro, Overpass Turbo, OpenStreetMap
About: This map shows the top and bottom 5 teams in Major League Baseball in attendance for the 2019 season. The map is based on this blog/tutorial from John Nelson showing how to use small multiples in a map document.
Process: Initially I was going to create a map that showed all 30 ballparks, but I decided to only show the top and bottom teams thinking that people would only want to see the leaders and the bottom teams. I used Overpass Turbo to download KML files of the stadiums from OpenStreetMap. After downloading the stadiums for the teams, I used ArcGIS Pro to convert the KML files to feature classes. Once all the KML files were converted, I symbolized the feature classes the way I wanted and started to build my map.
